Optimizing parameters to cut wait times
With the insights gathered from our analysis using multiple widgets, the pizza vendor is now in a position to make data-driven adjustments to improve the delivery process. The analysis highlighted delays and bottlenecks, particularly around the “Where’s my pizza?” and “Reassure customer” tasks. Additionally, the “Deliver the pizza” task, which showed a significant backlog of tokens and long mean wait times, indicated that the existing resource allocation for drivers was insufficient.
Adjusting delivery driver quantity
To address these performance issues, we can increase the number of delivery drivers from two to five. This decision is based on the data revealing that the limited number of drivers is a primary cause of the delays. By adjusting the resource allocation, we can streamline the process and reduce wait times.
We’ll start by adjusting the quantity of the delivery driver resource:
-
Click
to open the Definitions panel. -
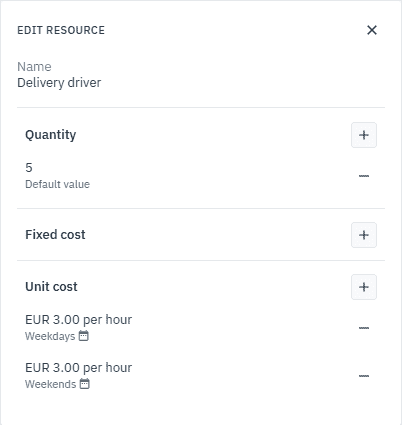
In Resources, click Delivery driver.
-
In the dialog box that opens, in Quantity, click the current setting.
-
In the dialog box that opens, set the quantity to 5.
Rerun the simulation
With the number of delivery drivers now increased, we can rerun the simulation to assess the impact of these changes. We’ll keep the same settings as the first run, we’ll only change the name for clarity.
-
In the toolbar, click Run.
-
In the dialog box that opens, configure these parameters:
Parameter Description Simulation name Delivery - 5 drivers Duration format Select Short format. Duration value Set to 1 week. Start date Set to 01/01/2025 06:00PM. -
Click Run.
Compare simulation results
We’ll now use the heatmap to compare the new simulation results against the previous simulation which used only 2 drivers.
When viewing the two heatmaps side by side, focusing on the Token In output, you’ll immediately notice a significant improvement. The areas that previously showed delays — specifically around the “Where’s my pizza?” and “Reassure customer” tasks — are now green, indicating smooth operations with low values.
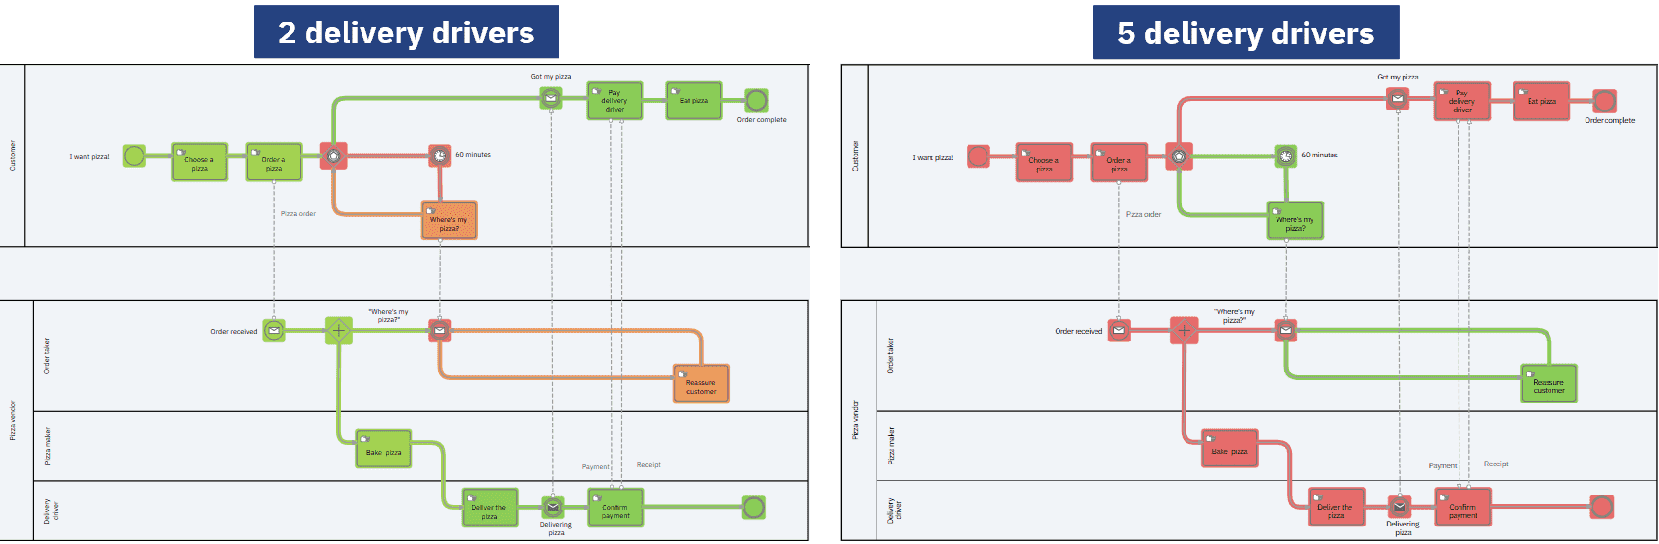
Digging deeper, we can see that both the “Where’s my pizza?” and “Reassure customer” tasks now show 0 tokens in, a clear sign that these tasks are no longer experiencing delays or customer complaints, signaling a more efficient flow.

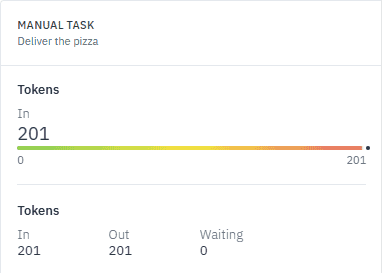
The “Deliver the pizza” task, in contrast, now appears red, indicating a high value — but in this context, that’s a positive outcome. With 201 tokens in and 201 tokens out, this suggests that the task is running at full capacity, efficiently handling the workload with the added drivers.
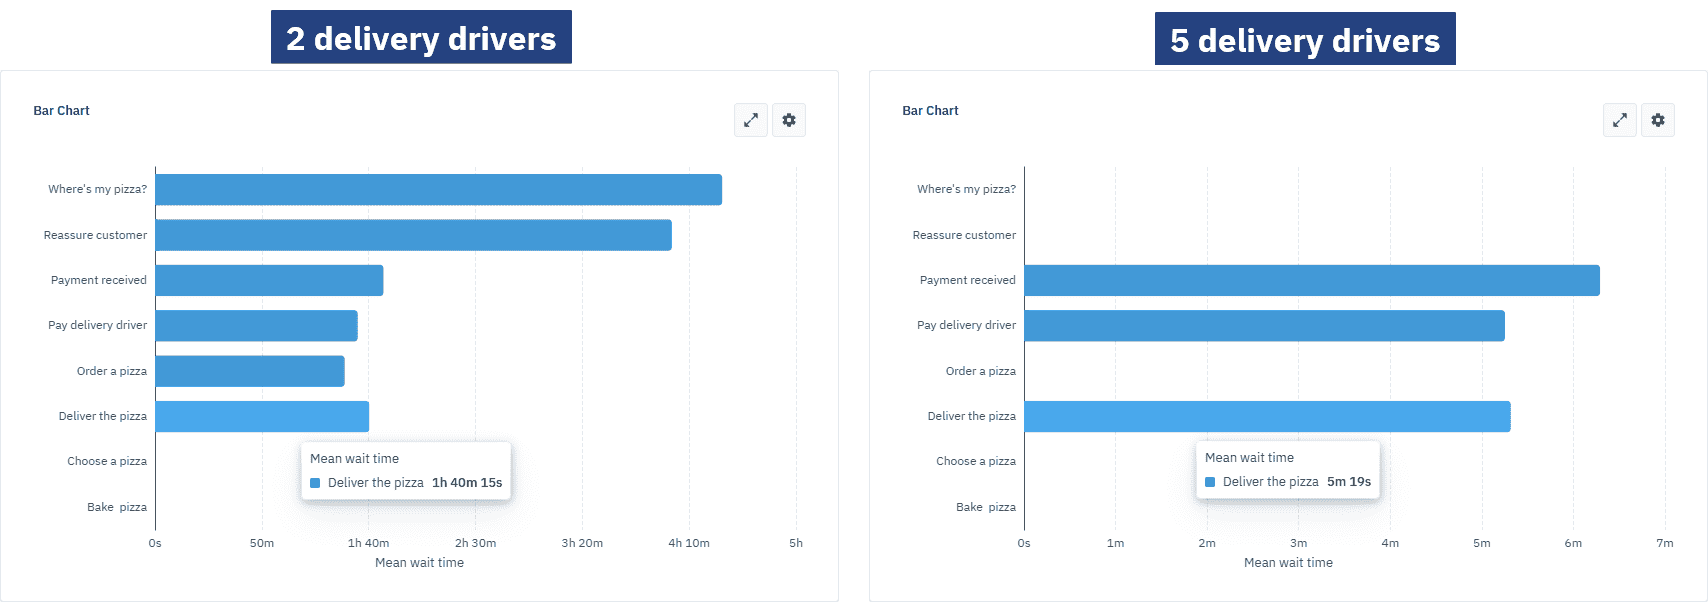
When we compare the wait times in the table, as we did with the first simulation run, the improvements are clear. For instance, the mean wait time has dropped dramatically from 1 hour, 40 minutes, and 15 seconds to just 5 minutes and 19 seconds. This significant reduction highlights the efficiency gained by increasing the number of drivers.
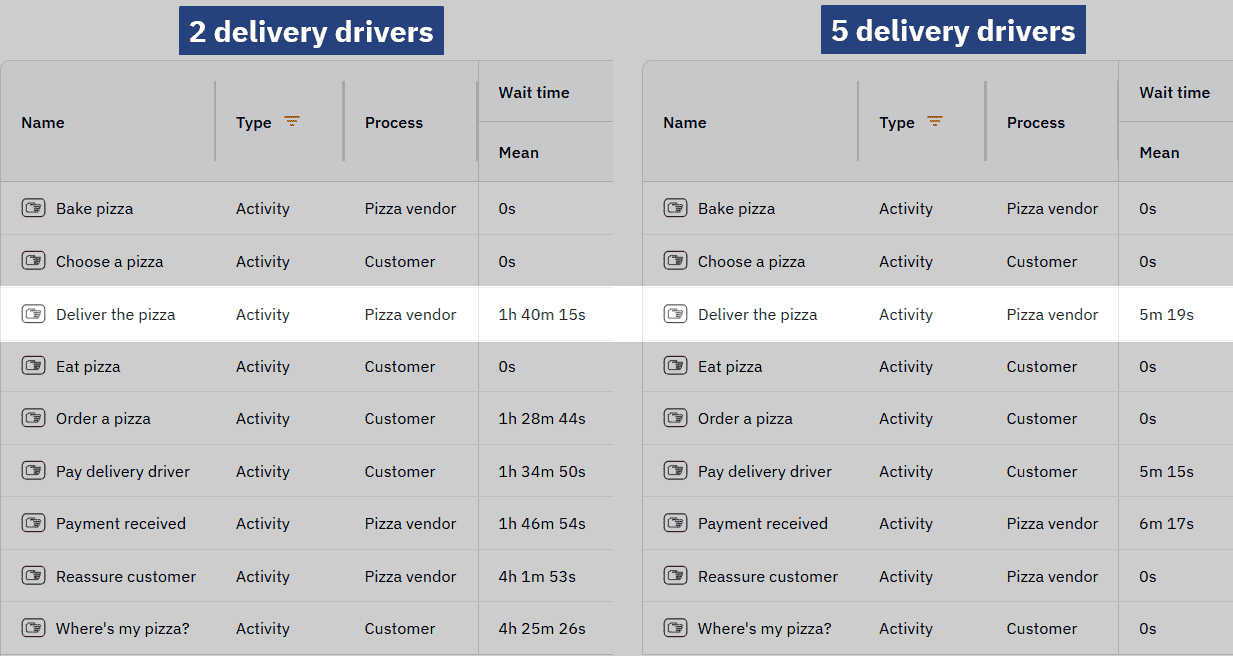
This same metric is clearly visible in the bar charts.
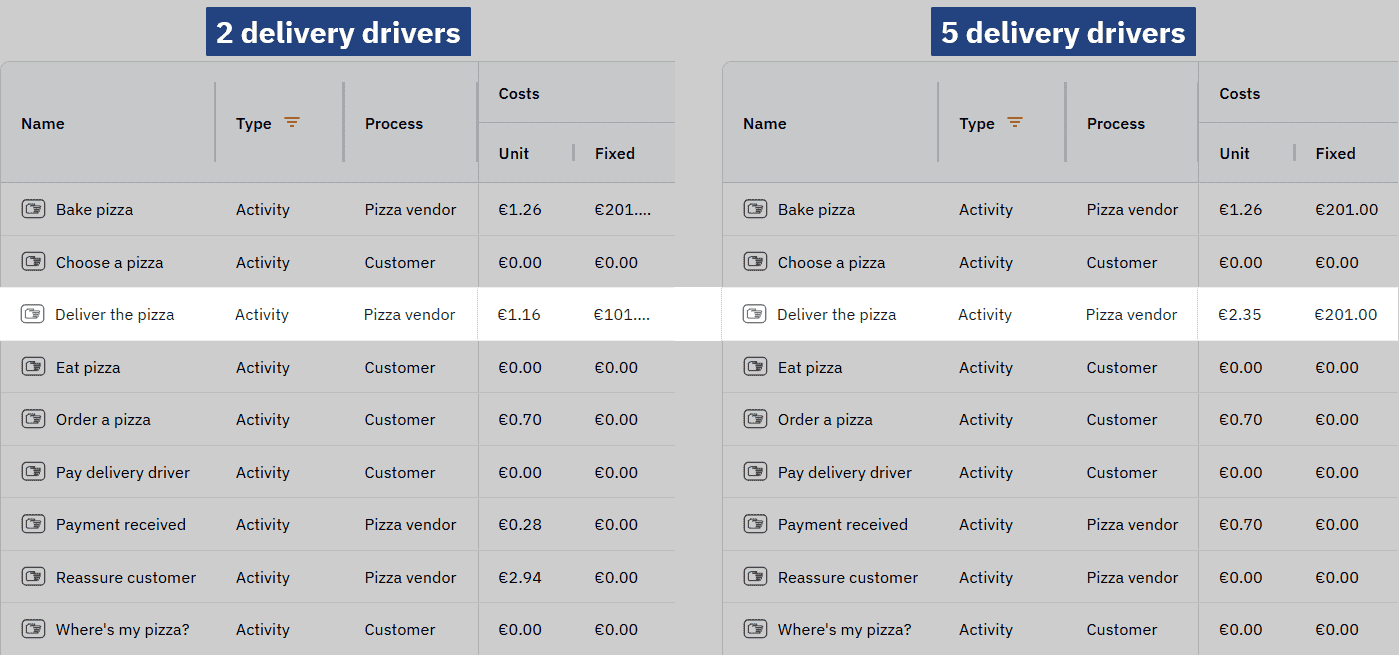
The table also enables us to perform a cost analysis by looking at the delivery drivers’ unit costs. With a unit cost of €1 per day, plus a fixed cost of €1 per pizza delivery, we can assess the impact of increasing the number of drivers.
While the increase in drivers results in higher resource costs, it also offers a clear trade-off. When we compare the costs between the two scenarios, we see the following: with the original 2-driver setup, the unit cost was €1.16, and the fixed cost amounted to €101. In contrast, the new 5-driver configuration brings the unit cost to €2.35 and the fixed cost to €201. Although the costs have risen, this increase is balanced by the fact that more pizzas are now being delivered, making the system more efficient overall.
Despite the higher costs, the vendor is benefiting from improved operational efficiency. The additional drivers allow order takers to focus solely on processing orders, rather than managing a busy line of customer inquiries. This shift streamlines the entire process, resulting in faster deliveries and better customer satisfaction. The added cost of more drivers is justified by the smoother workflow and enhanced performance, ultimately leading to better outcomes for the business.
By optimizing parameters and rerunning the simulation, we can see how the increased resources have helped eliminate the bottleneck and improved the overall flow of the pizza delivery process.
Now that the simulation is running smoothly, the pizza vendor is ready to take the next step: implementation. With the increased number of delivery drivers proving effective in the virtual environment, they can confidently apply these changes in the real world to see the improvements firsthand.
Try your hand at optimizing the process
There are plenty of other areas in the delivery process that could use some refining, and this is your chance to experiment! Play around with the heatmap, table and bar chart, adjust different parameters, and rerun simulations to see how your changes affect the flow. Don’t be afraid to try different combinations – this hands-on approach is a great way to learn how to use Cardanit Business Process Simulation to fine-tune a process and discover new ways to make it even better.